

Key Takeaways
- Google Analytics 4 (GA4) replaced Universal Analytics in July 2023 and introduced a completely redesigned reporting interface.
- Standard reports are pre-built and cover everyday metrics like traffic and engagement. Explorations is a separate section for custom analysis, such as funnels and path analyses.
- Not every report deserves equal attention. The ones worth checking regularly are those tied to a specific question you’re trying to answer.
- Checking a focused set of reports on a consistent schedule is more valuable than occasionally auditing everything at once.
If you’ve ever opened Google Analytics 4 and felt overwhelmed, you’re not alone.
GA4 replaced Universal Analytics in July 2023 and introduced a completely redesigned interface. With hundreds of data points across dozens of Google Analytics reports, it’s hard to know which ones are worth your time.
The good news? You don’t need to look at everything.
I’ve narrowed it down to the 12 best Google Analytics reports. These are the ones worth including in your metrics. I’ll also show you exactly where to find them in GA4 and how to put the data to good use.
What to Look for in a Google Analytics Report
GA4 organizes its reporting into two main categories: standard reports and explorations.
- Standard reports are pre-built templates that live under the Reports section in the left-hand navigation menu. They simplify your performance analysis because they’re ready to use from the get-go and cover most of the user data you’d want to see, such as traffic and engagement.
- Explorations live under Explore and are a separate section for more custom analysis. They go beyond standard reports, covering metrics like funnels and path analyses. They’re more powerful but require more setup. Think of standard reports as your regular dashboard and explorations as your analysis workspace.
The best reports are tied to a specific question you’re trying to answer. Where are users coming from? Which pages drive engagement? Where do people drop off before converting?
If a report doesn’t connect to a decision you can make, it’s not worth prioritizing right now.
The Best Google Analytics Reports for Marketers
Here are the 12 reports worth having on your regular radar, along with where to find them in GA4 and how to act on what they show.
1. User Acquisition Report
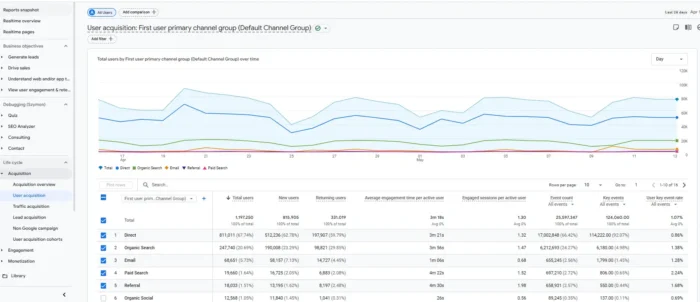
The user acquisition report shows how new users find your website for the first time. It’s broken down by channel: organic search, paid, social, direct, and referral. It’s your clearest read on which marketing efforts are growing your audience.
User acquisition tracks how users were first acquired, while the traffic acquisition report (which we’ll cover next) shows where sessions come from, including those from returning users.
If paid traffic looks strong in traffic acquisition but weak here, you’re likely good at re-engaging existing users but struggling to reach new ones. And that’s a different problem requiring a different fix.
Where it lives: Reports > Acquisition > User Acquisition.
2. Traffic Acquisition Report
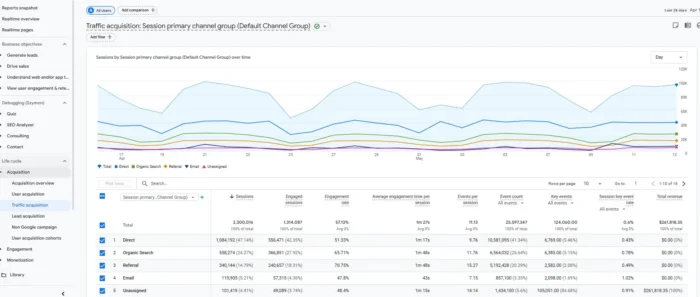
GA4’s traffic acquisition shows where each visit comes from, not just how someone first found you, making it a better tool for week-over-week trend monitoring.
As a Google Analytics SEO report, it’s useful for quick diagnostics. For instance, you might use it to compare a specific date to historical performance or conduct a channel-by-channel scan.
A dip in organic traffic while other channels hold steady might point to a ranking change or technical SEO issue, not a site-wide problem. That distinction’s a big deal for deciding how to respond.
Where it lives: Reports > Acquisition > Traffic Acquisition.
3. Pages and Screens Report
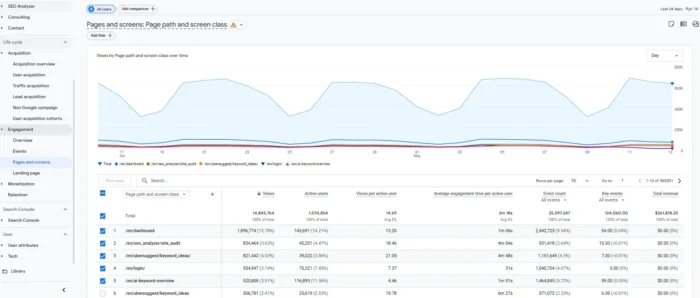
Pages and screens reports break down page views, average engagement time, and other engagement metrics by individual page or screen (individual screens on a mobile app).
These are foundational content marketing analytics data points. They make a solid starting point for understanding which posts are pulling their weight and which aren’t. You can sort by views to find high-traffic pages, and then cross-reference the engagement rate.
For example, a page driving strong traffic but showing low engagement might signal a mismatch between what users expected and what they found. That’s a page worth auditing before creating more content on the same topic.
Where it lives: Reports > Engagement > Pages and Screens.
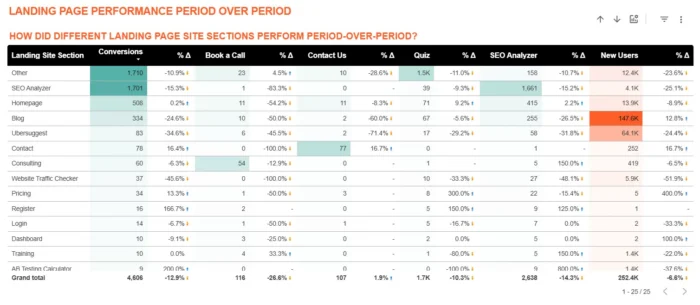
4. Landing Page Report
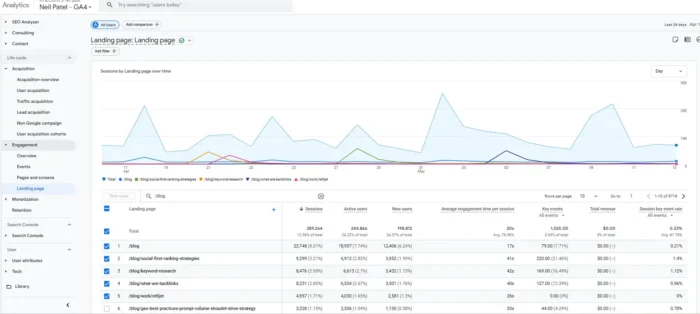
Unlike the pages and screens report, which measures all page activity, the landing page report focuses on the first page a user lands on during a visit. Landing pages reveal which content is pulling traffic from sources like social or paid campaigns.
A landing page with high sessions and a low engagement rate could be telling you the entry experience doesn’t match what brought users there. That can be where conversion problems start, and it’s the right place to diagnose them before testing other changes.
Where it lives: Reports > Engagement > Landing Page.
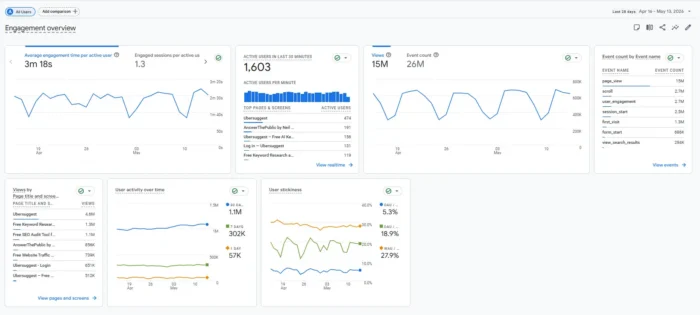
5. Engagement Overview Report
The engagement overview report gives you a quick pulse check on how actively people interact with your site. Use it to monitor engagement trends across your website and spot sudden changes before digging into individual pages or channels.
GA4 emphasizes engagement rate over the old UA bounce rate model. It measures the percentage of sessions that last longer than 10 seconds, involve a key event, or have at least two page or screen views.
According to Databox benchmark data, the median engagement rate across all industries sits at 56.23 percent.
That’s a helpful reference point, if not a universal target. A meaningful drop in one traffic channel can signal a content mismatch or a technical issue that’s cutting sessions short (like a slow-loading page).
Where it lives: Reports > Engagement > Overview.
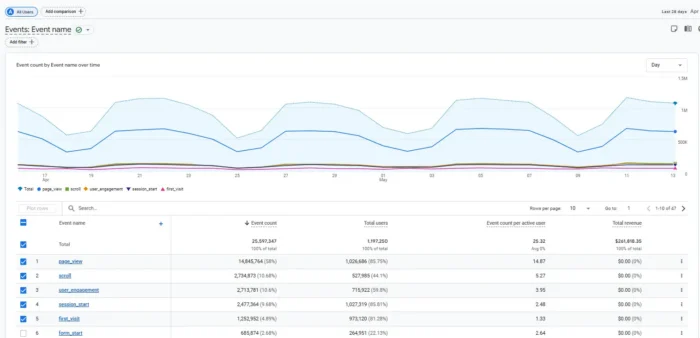
6. Events Report
GA4 tracks user interactions as events, including page views, clicks, form submissions, and other actions you configure.
The events report shows what’s firing on your site and how often each action occurs. You’ll also be able to see the events you’ve marked as key events, aka conversions.
Use this report to check your conversion tracking before judging content performance. If a form submission or sign-up isn’t set up as a key event, for example, your content may look like it’s underperforming even when users are taking valuable actions.
Before you rewrite a page or change your strategy, make sure GA4 is tracking the outcome you care about.
Where it lives: Reports > Engagement > Events.

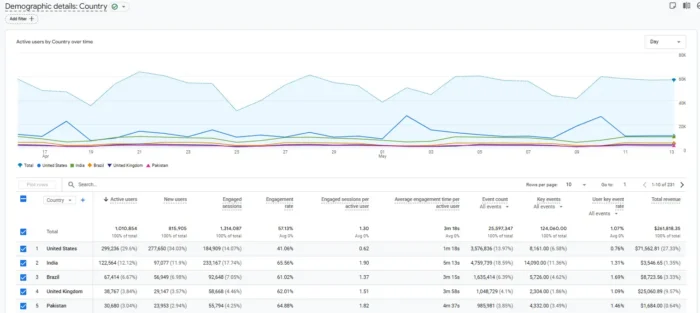
7. Demographic Details Report
Google’s demographic details report is great for seeing whether the people you’re reaching are genuinely your target audience. It breaks down your audience by details like age or interests. This pairs well with acquisition data if you’re monitoring Google Analytics for social media performance.
If campaigns targeting 35- to 54-year-old professionals are generating traffic that skews heavily under 25, that demographic mismatch shows up here before it turns up in the conversion numbers. That gives you a chance to correct targeting before spending more.
Where it lives: Reports > User Attributes > Demographic Details.
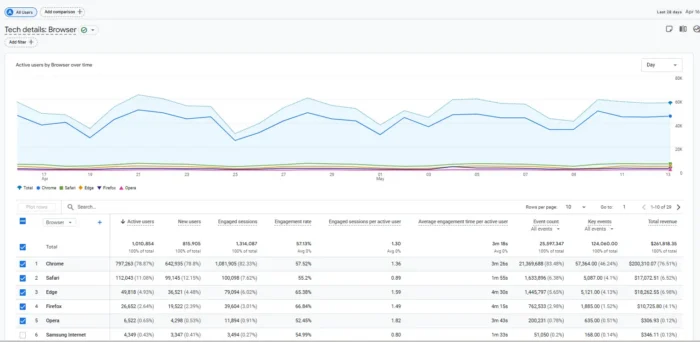
8. Tech Overview Report
Mobile accounts for more than half of global web traffic, which means a mobile performance problem can quickly become a revenue problem. The tech overview report is where you look to find those problems.
Sort by device category and compare conversion rates between mobile and desktop. A significant gap might indicate slow load times or a layout that doesn’t translate well to smaller screens.
Browser breakdown is worth checking, too, since compatibility issues often affect more users than you might expect.
Where it lives: Reports > User > Tech > Tech Overview.
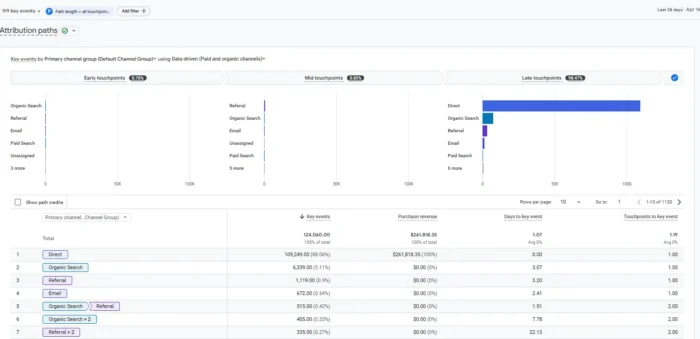
9. Key Event Attribution (Conversion) Paths Report
Key event attribution is one of the more revealing Google Analytics SEO report views in the platform, showing how organic search contributes across multi-touch journeys.
Last-click attribution models give all the credit to the final channel a user touched before converting. The key event attribution paths report (formerly the conversions report) provides a fuller view, showing the touchpoints a user interacted with along the path to a conversion.
If social or display advertising consistently appears early in conversion paths, those channels deserve budget even when they don’t earn last-click credit.
Where it lives: Advertising > Key Events > Key Event Attribution Paths
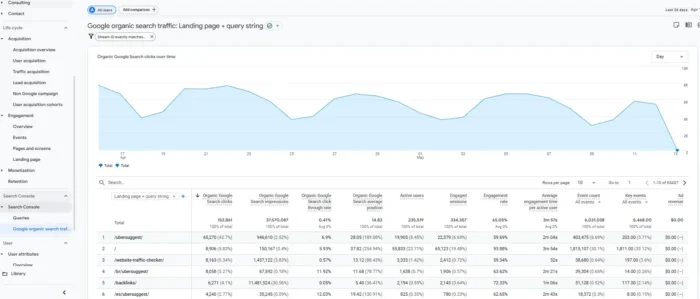
10. Search Console Report
Once you link Google Search Console to GA4, you can view organic search data inside Analytics. Metrics like queries and clicks are all tied to the landing pages they lead to.
The Console-GA4 combination puts this among the most actionable Google Analytics SEO reports.
You can see which queries drive traffic to specific pages and where impression numbers don’t match click-through rates. The report can also uncover which pages rank but don’t convert.
Each data point provides key context, enabling you to fix multiple tracking issues all in one place.
Where it lives: Reports > Acquisition > Search Console (requires linking Google Search Console to GA4).
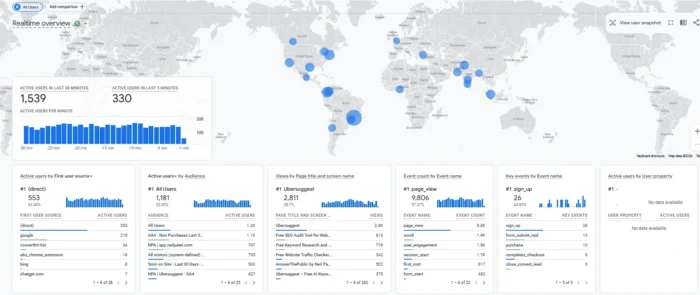
11. Realtime Pages Report
This report shows which pages people are viewing right now and how many users are on each page. It’s less useful for strategic analysis than the others on this list, but it’s genuinely valuable as a QA tool.
Say you’ve just pushed a campaign live. You can confirm tracking is firing before you make future spending decisions.
Realtime can also help you confirm whether new posts or key event changes are working before standard reports catch up.
Where it lives: Reports > Real-Time.
12. Retention Overview Report
Retention is where sustainable growth happens. The retention overview report shows whether users return to your site after their first visit and how engaged they are after they’re acquired. It’s broken down by cohort over time.
Getting people to come back builds compounding authority and revenue. A declining retention curve can reveal gaps in content quality or user experience issues.
These trends are worth investigating before pushing harder on acquisition, because more traffic will only amplify these issues.
Where it lives: Reports > Retention.
When to Use a Google Analytics Report Template
GA4 lets you customize reports and save them in your library. That way, you can reuse reports without rebuilding them each time.
If you or your team need to share performance data with clients or leadership, Data Studio (formerly Looker Studio) is usually the better option.
Data Studio is Google’s free data visualization tool and connects directly to GA4. You can also use pre-built Google Analytics report templates from providers like Supermetrics and Porter Metrics. These ready-made dashboards cover key data, including traffic overviews and ecommerce performance.
Templates let you stand up a shareable, auto-refreshing dashboard without building from scratch, a real time-saver for anyone reporting to stakeholders who don’t log into GA4 directly.
FAQs
How do I create reports in Google Analytics?
GA4 includes pre-built reports in the left navigation under Reports. To build a custom report, go to Reports > Library and select “Create new report.” For deeper analysis, like funnel exploration, use the Explore section. This operates separately from standard reports and offers more flexible visualization options.
How do I automate Google Analytics reports?
GA4 doesn’t offer native scheduled report delivery, but Data Studio (formerly Looker Studio) handles this cleanly. Connect your GA4 property, build or copy a template, then use the scheduled email feature to send reports at your preferred cadence automatically. Tools like Porter Metrics and Supermetrics extend this further for agencies managing multiple properties or clients.
{
“@context”: ”
“@type”: “FAQPage”,
“mainEntity”: [
{
“@type”: “Question”,
“name”: “How do I create reports in Google Analytics?”,
“acceptedAnswer”: {
“@type”: “Answer”,
“text”: “
GA4 includes pre-built reports in the left navigation under Reports. To build a custom report, go to Reports > Library and select “Create new report.” For deeper analysis, like funnel exploration, use the Explore section. This operates separately from standard reports and offers more flexible visualization options.
”
}
}
, {
“@type”: “Question”,
“name”: “How do I automate Google Analytics reports?”,
“acceptedAnswer”: {
“@type”: “Answer”,
“text”: “
GA4 doesn’t offer native scheduled report delivery, but Data Studio (formerly Looker Studio) handles this cleanly. Connect your GA4 property, build or copy a template, then use the scheduled email feature to send reports at your preferred cadence automatically. Tools like Porter Metrics and Supermetrics extend this further for agencies managing multiple properties or clients.
”
}
}
]
}
Conclusion
GA4 populates a ton of data points. It’s on marketers to sift through the noise and boil things down to the reports that move the business needle.
A good place to start is picking two or three Google Analytics reports from this list that fit your current business goals.
If growing organic traffic is your focus, you might begin with the Search Console and traffic acquisition reports. If conversion rate is the priority, events and attribution paths can show you where the gaps are.
Whatever reports resonate with your business case, build a review cadence and stick to it. The more consistent you are, the easier it is to spot patterns and make better calls.
