
Key Takeaways
- An AI visibility report tracks how often your brand is cited across AI-generated responses. Think of it as a companion to your SEO reporting, not a replacement for it.
- Your tracked prompt set is the foundation of every number Writesonic shows you. If you don’t understand what those prompts cover, you’ll misread your data.
- Portfolios organize your tracked URLs by content type. Get this set up early and keep it updated as new content goes live.
- Citation data is inherently noisy. A single-period dip rarely means anything. A sustained two-to-three-month trend does.
- The Action Center is where the quick wins live. Use it to find pages with citation visibility gaps and start closing them.
Here’s something that should keep marketers up at night: your buyers are researching purchases in ChatGPT and Perplexity, and most brands have no idea whether they’re showing up in those answers.
That gap is exactly what an AI visibility report is built to close. It tells you how often your brand gets cited in AI-generated responses, which pages are driving those citations, and where competitors are outperforming you in the moments that matter most.
Writesonic has one of the more practical toolsets for building this kind of reporting. But I want to make one thing clear: I’m not trying to do a review of the platform. This is a working guide for content teams that need to get this reporting off the ground and want to understand what the data actually means before they put it in front of a client or a leadership team.
Why AI Visibility Reporting Matters for Marketing Teams
Buyers don’t just Google things anymore. A growing portion of them open ChatGPT, type a question, and act on whatever comes back. Salesforce research found that 41 percent of consumers used AI tools as part of their research process in 2024. That number has only grown since.
If your brand isn’t being cited in those responses, you’re losing potential customers.
AI visibility reporting helps you understand not just if you appear, but which topics you’re being cited for, how that’s changing over time, and who’s beating you in the answers your buyers are reading.
Where this fits in your stack matters, too. AI visibility reporting isn’t a replacement for organic search analytics or conversion data, but an added signal. This tells you whether AI systems find your content credible enough to surface. Teams that treat it as a complement to their larger organic strategy get more out of it than those trying to use it standalone.
The two questions it should help you answer: Are we showing up where buyers are actually looking? And if not, what do we fix first?
Understanding Your Prompt Set Before You Report on Anything
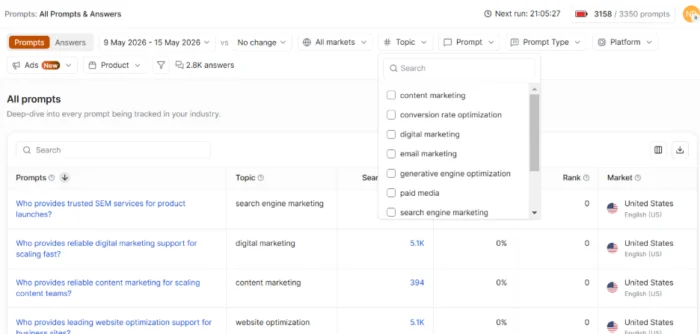
Every number in Writesonic traces back to your tracked prompt set. These are the specific questions the platform monitors across ChatGPT, Perplexity, Gemini, and other AI tools to see whether your content gets cited in the response.
Get this wrong, and everything downstream looks worse than it is.
The platform assigns default topic labels to clusters of prompts. Those labels are usually broad. A marketing blog running this kind of reporting might see their prompt topics labeled “content marketing” and “digital marketing.” Both are accurate but they are closely related terms that cover a huge swathe of subtopics. Due to the lack of specificity, you may encounter issues building and reporting on AI visibility if you only rely on the pre-populated topic list.
Here’s what works better: export the full prompt list, drop it into an AI tool, and ask it to summarize the underlying themes, intent types, and audience categories. That same marketing agency’s list of 100 prompts might actually break into much more specific themes, like Organic & search visibility, Paid media & SEM, and Email & conversion.

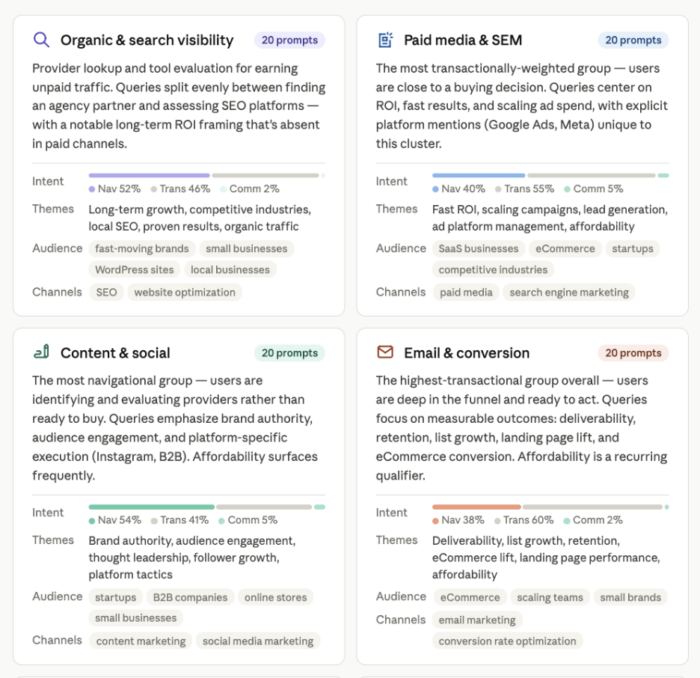
The screenshot above is a portion of Claude’s output when I asked it to perform this exercise. As you can see, there’s a lot more information here to guide our content reporting (and creation). Not only do we have a clearer idea of the GEO content pillars we’re tracking against, but also the audience and intent for each category.
This type of output influences how you read everything else. If you find that your prompt set skews heavily toward one audience, your citation numbers for content aimed at a different audience will look artificially low. You can’t treat this as losing ground. You’re just being measured against prompts that page was never written for.
The practical rule: only report on content that genuinely aligns with your tracked prompt themes. Flagging low citation share on a page that serves a completely different audience creates confusion in client reports. Know your prompt set first, then interpret your data.
To pull the list, navigate to the Prompts section and use the export option. Fifteen minutes of AI-assisted theme analysis is worth doing before you touch anything else.
Setting Up Portfolios to Track Your Content Over Time
Portfolios are folders. They allow you to organize the URLs you’re tracking by content type so you can report on categories rather than hunting down individual pages every time you pull a report.

Create them early and keep them simple. At minimum, you want separate portfolios for blog posts, core website pages, and comprehensive guides. If your client has distinct product lines or service areas, break those out too.
The part that really matters is the workflow. As soon as a new piece of content goes live, add the URL to its portfolio. Teams that skip this step spend far too much time during reporting cycles searching for pages that should have been tracked from day one. Make it part of the implementation process: publish, review, then add to portfolio.
One thing worth knowing: portfolios aren’t limited to your own content. You can add competitor URLs and track their citation performance in the same view. That’s useful when you need to show a client exactly where a competitor is outpacing them on a specific topic, without having to cross-reference separate reports mid-meeting.
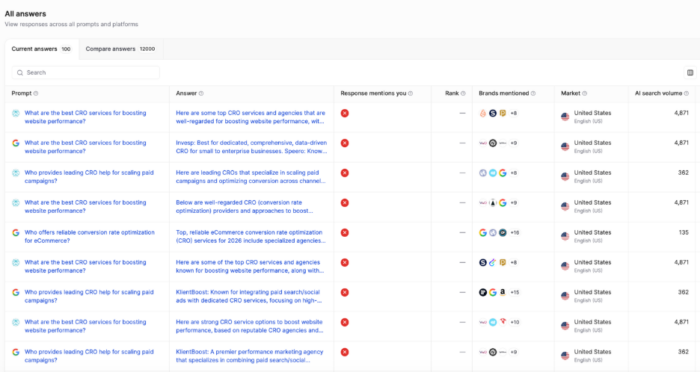
How to Report on a Single Piece of Content
The path is: Overview > Citations > Content Performance. Set your date range and filter by URL slug.

You’ll mainly want to look at Citation Count or Citing Answers, which are how many times that page was cited across all tracked prompts in the selected period.
If you look at Citation Share, the number may appear small. That’s because this view measures a single page’s citation contribution across your entire prompt set, not just the prompts that are relevant to what the page covers. A tightly focused blog post will naturally have limited citation surface area relative to the full prompt universe you’re tracking.
Second, pay attention to the prompts the page is and more importantly, is not being cited for. You can see the full prompt set by clicking on the number in the ‘Answers citing your content’ tab. In this case, I clicked on the 100.
You’ll then be taken to the All Prompts & Answers view, where you can see which prompts and platforms are surfacing your content and which ones are not.

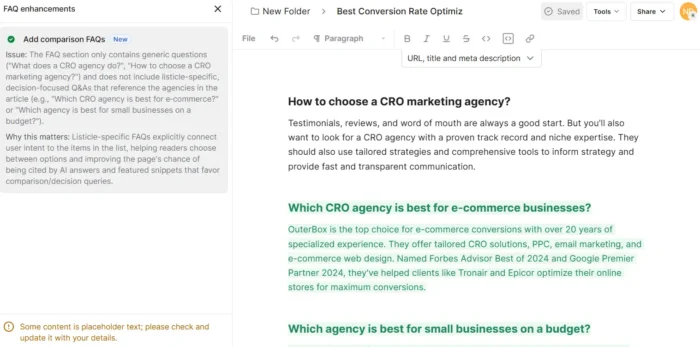
If a page is ranking well for some prompts but missing others that closely match its content, those gaps are actionable. Adding a structured FAQ section or a more direct answer to a specific question can sometimes close them — and that’s something Writesonic can help you generate.
Third, be careful with month-over-month comparisons. A single dip is not a signal. LLM citation patterns shift constantly as models update and competitive content changes. Before treating a decrease as a problem, remove the comparison period and look at a three-to-four-month trend line instead. A trough followed by recovery is a very different story than a genuine sustained decline.
When you do see a real downward trend, don’t touch the content first. Cross-reference with your SEO data and generative engine optimization metrics. Often, the issue is external, like a model update, and editing the content won’t fix it.
Reporting Content Categories with Portfolios
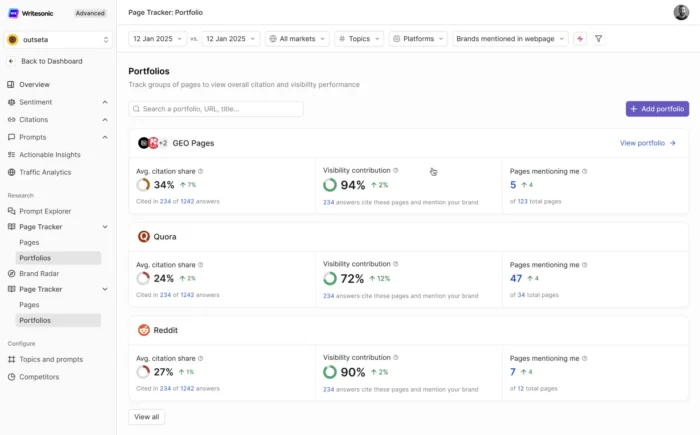
Another useful feature inside Writesonic is the ability to report on content performance at the portfolio level, not just the page level.
To access it, navigate to Overview > Page Tracker > Portfolios. If you’ve organized portfolios by content type, topic cluster, service area, or funnel stage, this view gives you a meaningful way to evaluate how a group of pages is collectively performing in AI-generated answers.
This matters because page-level reporting only tells you so much. When you’re managing a content program at scale, you need to be able to say, “our informational content about hotel amenities is being cited regularly” or “our location-based pages are getting picked up but not driving brand mentions.” Portfolios let you have that conversation at the category level, which is how most content strategies are built and how most stakeholders think about performance.
Two metrics worth understanding here are citation share and visibility contribution.

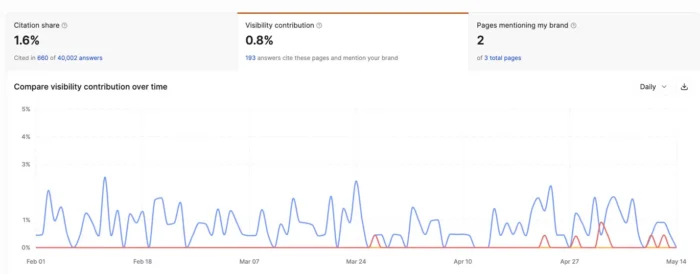
Citation share tells you what percentage of all AI answers cite at least one page from that portfolio. Think of it as reach for that content category. A 1.6% citation share, like the example above, means those pages appeared in roughly 660 out of 40,000 tracked answers. Reported at the portfolio level, this becomes a concrete benchmark you can share: how often AI tools are drawing from this type of content, and how that’s trending over time.
Visibility contribution is a layer deeper. It measures the percentage of your brand’s total AI visibility that comes from pages in that portfolio being cited alongside a brand mention. It tells you which content categories are driving brand recognition in AI answers, not just traffic or citations. A portfolio with strong visibility contribution means your content and your brand name are appearing together in AI responses, which is the outcome you’re optimizing for.
Together, these two metrics help you go beyond vanity reporting and start answering the questions clients and stakeholders actually care about: Is this content working? Are people seeing our brand name? Which content categories should we double down on, and which need attention?
If a portfolio has solid citation share but low visibility contribution, AI tools are referencing those pages frequently but not associating them with your brand. That’s a signal to look at how clearly your brand is represented within the content itself. If a portfolio is underperforming on both, that’s a prioritization conversation. And if a portfolio is driving strong numbers on both, that’s proof-of-concept worth scaling.
Understanding Volatility: What’s Signal and What’s Noise?
LLM citation data is noisy by nature. This isn’t a Writesonic-specific problem. It’s how these models work. AI citation drift, where sources shift in and out of responses as models retrain, re-rank sources, or adjust sampling, has been documented across platforms. Research from SISTRIX shows citation sources can change significantly week over week, even when the underlying content is untouched.
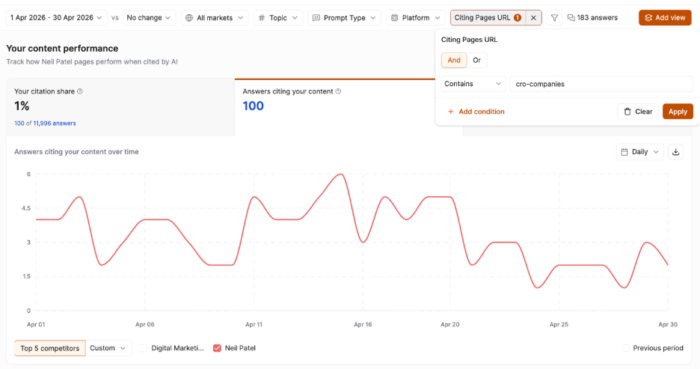
One data point tells you almost nothing. The question is always whether you’re looking at a trend or a snapshot.

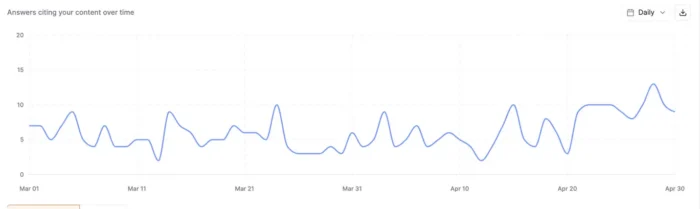
For example, look at the graph above. This shows the number of citations a page has over a two-month span. As you can see, there are several peaks and valleys, even within the span of a few days. However, if you were to draw a trend line, the result would be relatively flat and even increase a bit towards the end of the second month.
That’s why it’s important to remember that a one-period decrease is not a call to action. A consistent downward pattern over two to three months is worth digging into. Before you touch any content, pull SEO performance and AI Overview impression data for the same window. If organic traffic is stable and AI Overview appearances are flat, the Writesonic dip is most likely a model or sampling artifact.
This is worth saying explicitly to leadership and clients. AI visibility reporting is newer and messier than traditional SEO reporting. Setting that expectation upfront builds credibility. Trying to explain unexpected volatility after the fact does the opposite.
What Writesonic Can’t Tell You
Transparency on limitations makes reporting more credible, not less.
As mentioned earlier, Writesonic tracks a defined prompt set, not every AI query relevant to your category. Your citation numbers reflect performance within that sample. That distinction matters when someone asks why results look lower than expected. The tracked set may simply not cover the full range of queries where your content performs well.
Other things to be aware of include:
Prompt volume isn’t search volume. AI platforms don’t publish query data the way Google does. Estimating how many times people search specific prompts in platforms like ChatGPT requires multiple data sources, a scoring methodology, and sampled user data. That means LLM prompt volume should always be taken with a grain of salt, no matter what AI visibility platform you’re using.
Citation change versus buyer behavior. A drop in citations might reflect a model update or a competitor adding a stronger page. It doesn’t necessarily mean fewer buyers are encountering your brand. Separating those two things requires additional data sources like conversion tracking, qualitative research, or broader competitive analysis.
Competitive visibility outside the tracked set. You can see how competitors are performing within your prompt set. You can’t see how they’re performing in AI queries you aren’t tracking at all.
For each gap, the fix is the same: layer in additional signals. Use organic performance, GEO and AEO analysis alongside broader competitive research to paint the full picture. Writesonic works best as one input among several, not as a standalone source of truth.
Using Quick Wins to Improve AI Visibility Now
The Action Center is where the most immediately actionable reporting lives. Navigate to Action Center > Boost Content Visibility > Refresh existing content for AI visibility to find existing pages where competitors are being cited more often than you for the same prompts.

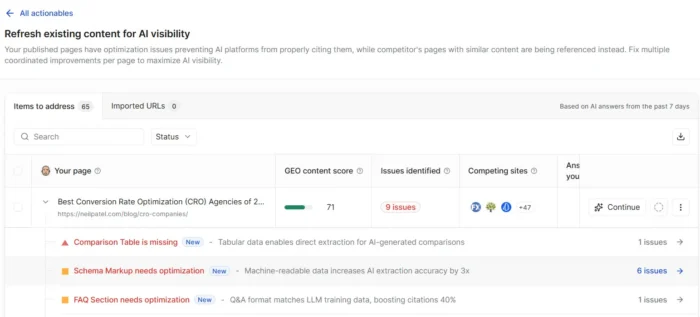
These are your quick wins. The pages themselves usually aren’t the problem; they’re just missing specific structural elements that AI models tend to pull from. Common recommendations from the platform include FAQ sections, comparison tables, and explicit key takeaway sections. These signal to large language models (LLMs) that a page directly answers a specific question and improves your chances of being cited.
Writesonic will generate draft versions of those elements for you. Use them as a starting point, not a final output. Editorial judgment still applies. Not every recommendation fits every page. A conversion-focused product page probably shouldn’t get a sprawling FAQ section that complicates the user journey, even if the data suggests it would improve citation share.

This module is particularly useful at campaign kick-off. Teams can surface concrete page improvements in the first few weeks while the broader strategy is still being developed, giving clients something tangible early.
New Content Opportunities in the Action Center
Beyond refreshing existing pages, the Action Center also identifies topics where competitors are earning citations, and you have no content covering them at all.
Navigate to Action Center > Boost Content Visibility > Create content inspired by competitors winning in AI citations for this view. The recommendations here are about where to create new pages or blog posts, not about tweaking what you have. If a competitor is consistently cited on a topic that aligns with your tracked prompt themes and your site has nothing on it, that’s a real gap in your AI visibility coverage, and a direct input for your content calendar.

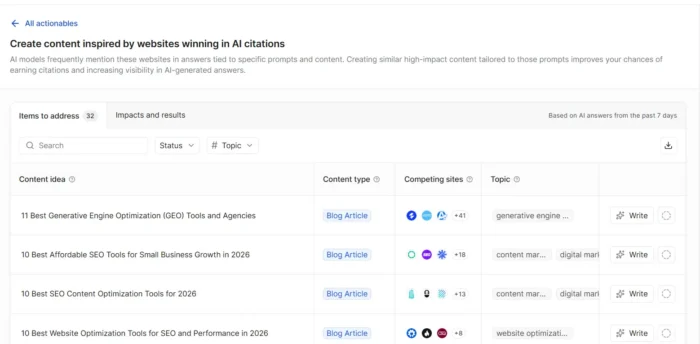
Review this section at least quarterly alongside your standard keyword research. The two often point in the same direction.
FAQs
What KPIs matter for executive AI visibility reporting?
Lead with citation share trend direction over a rolling 90-day period, not raw citation counts. Raw numbers require too much context without supporting data. Showing category-level performance for priority topics, plus specific wins and gaps, lands better in executive reporting than a single number that needs a two-paragraph explanation.
How do you create reports showing brand visibility in AI platforms?
Use Writesonic’s Content Performance and Page Tracker views to pull citation data by URL and topic. Present directional trends and be explicit about what your prompt set covers.
How do you report AI search visibility to leadership?
Frame AI visibility as one signal alongside organic search, not a standalone metric. Show specific wins (pages gaining citation share) alongside gaps, and tie recommendations directly to business priorities. Explain volatility upfront so a single-period dip doesn’t derail an entire reporting session.
Where can you find AI visibility reports with sentiment analysis?
Writesonic includes sentiment indicators alongside citation data. You can dig deeper into how your brand is being discussed on LLMs by navigating to Overview, then the Sentiment dashboard under Brand Visibility.
{
“@context”: ”
“@type”: “FAQPage”,
“mainEntity”: [
{
“@type”: “Question”,
“name”: “What KPIs matter for executive AI visibility reporting? “,
“acceptedAnswer”: {
“@type”: “Answer”,
“text”: “
Lead with citation share trend direction over a rolling 90-day period, not raw citation counts. Raw numbers require too much context without supporting data. Showing category-level performance for priority topics, plus specific wins and gaps, lands better in executive reporting than a single number that needs a two-paragraph explanation.
”
}
}
, {
“@type”: “Question”,
“name”: ” How do you create reports showing brand visibility in AI platforms? “,
“acceptedAnswer”: {
“@type”: “Answer”,
“text”: “
Use Writesonic’s Content Performance and Page Tracker views to pull citation data by URL and topic. Present directional trends and be explicit about what your prompt set covers.
”
}
}
, {
“@type”: “Question”,
“name”: “How do you report AI search visibility to leadership? “,
“acceptedAnswer”: {
“@type”: “Answer”,
“text”: “
Frame AI visibility as one signal alongside organic search, not a standalone metric. Show specific wins (pages gaining citation share) alongside gaps, and tie recommendations directly to business priorities. Explain volatility upfront so a single-period dip doesn’t derail an entire reporting session.
”
}
}
, {
“@type”: “Question”,
“name”: “Where can you find AI visibility reports with sentiment analysis? “,
“acceptedAnswer”: {
“@type”: “Answer”,
“text”: “
Writesonic includes sentiment indicators alongside citation data. You can dig deeper into how your brand is being discussed on LLMs by navigating to Overview, then the Sentiment dashboard under Brand Visibility.
”
}
}
]
}
Conclusion
Most teams that struggle with AI visibility reporting don’t have a data problem. They have an interpretation problem. The numbers look strange, the volatility is hard to explain, and it’s difficult to know what to act on.
Writesonic helps with that, but only if you come in with the right expectations. Know what your prompt set covers. Organize your portfolios from the start. Read citation data as a directional trend, not a precise scorecard. Use the Action Center to find the generative engine optimization improvements most likely to move the needle quickly. Teams that build these habits now will be ahead of the curve as AI-driven search grows and the tools mature.